
About the Project
We first conducted an exploratory pilot study with over 40 participants from both STEM (Science, Technology, Engineering, Math) and Creative fields that was designed with open ended questions. Then we created categories of responses, which were used in designing the final survey. The survey protocols were designed in accordance with Stony Brook University's Institutional Review Board approval.
The RespondEnts
While the final survey was answered by 324 participants, in the end we only included surveys that were over 40% complete: 110 Creative/Art and 161 STEM professionals. Around 30 participants identified as “Other” and saw themselves as a mix of STEM and Art; this group is not included in this article. Respondents were at various stages in the careers and ranged from university professors, graduate students and research scientists to visual artists, dancers, and advertising/marketing professionals. Intentionally, the majority of the STEM professionals were recruited through organizations interested in science communication or outreach, so they are familiar with and/or practicing science communication.
Seventy-three percent identified as female, and, although the majority of the respondents were from North America, we had a large contingent from Europe and some from as far away as New Zealand and Japan.
Respondents were recruited largely online via AAAS (American Association for Advancing Science)’s social media platform, Trellis, and through various listservs and organizations including the National Alliance for Broader Impacts (NAMBI), the Alan Alda Center for Communicating Science, AIGA (American Institute for Graphic Arts), and the SciArt Center. We posted the survey on social media platforms from s several organizations, including COPUS (Coalition on the Public Understanding of Science) and marketing and ad industry presences. We also contacted several online professional networks for women in technology and science including The List, Dreamers and Doers, and Women Futurists Collective, and 500 Women Scientists. We posted the survey on Facebook, Twitter, and Instagram via our own social media accounts and organizations involved in Science, Science Communications, Arts, and Advertising, as well as universities.
General field

Age %

Gender %

Years in field %
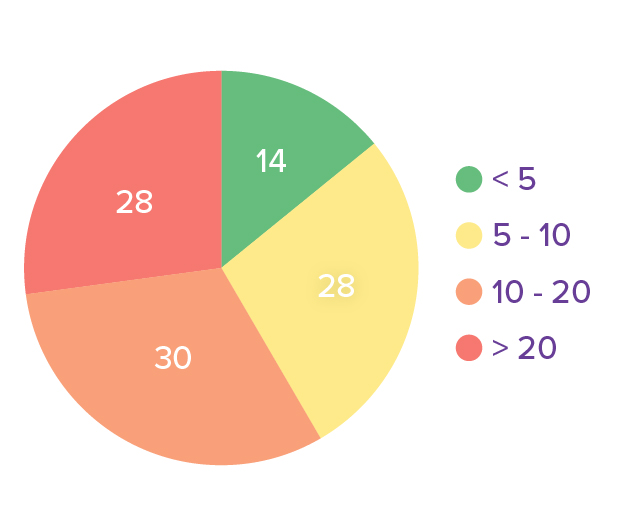
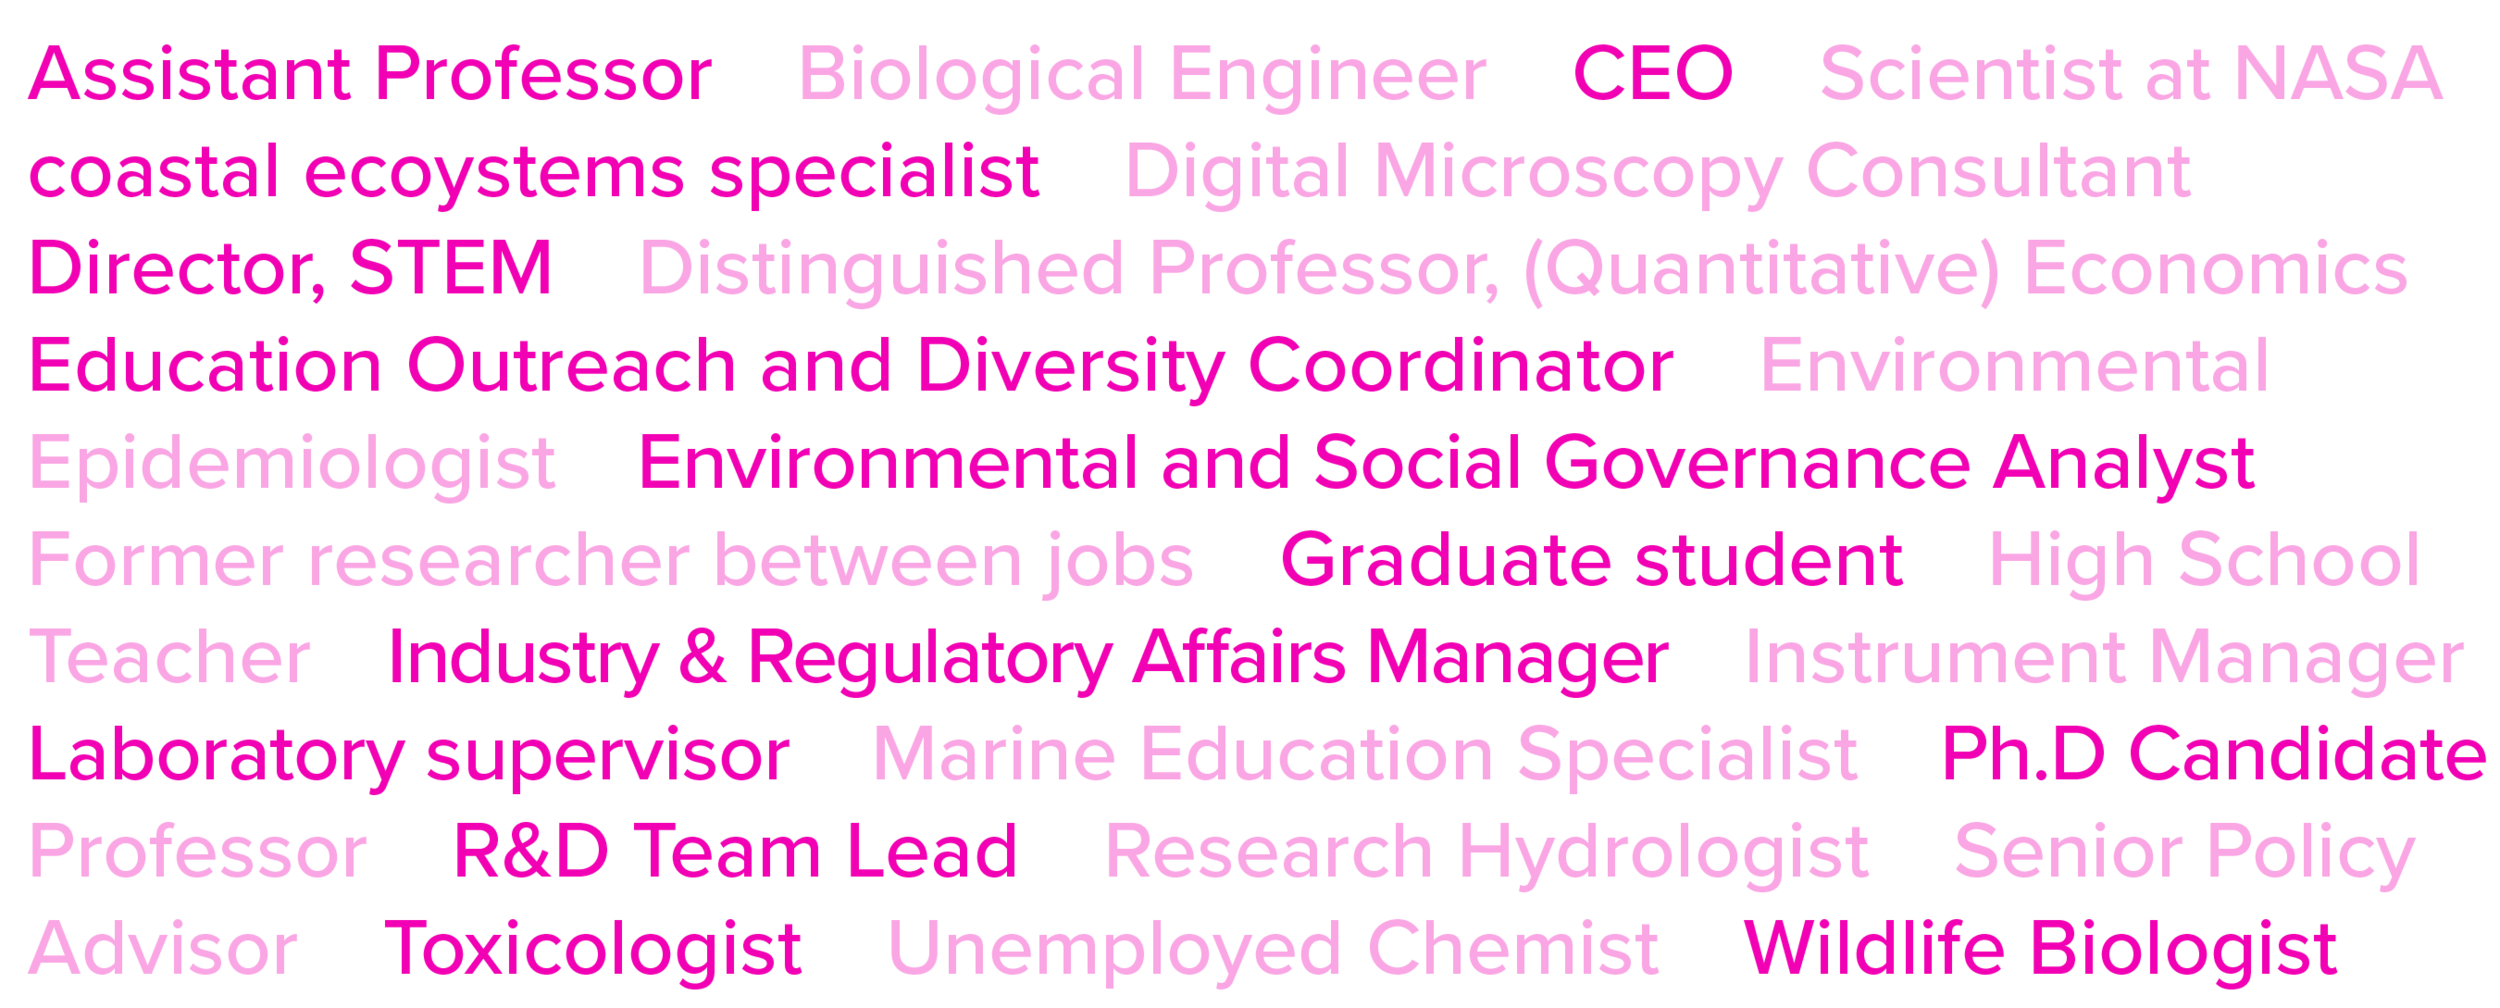
Specific Fields
This is a sampling of the specialty areas for Creative (cyan) and STEM (magenta) respondents. For an index of alphabetized specialty areas, view Creative respondents and STEM respondents.
Creative

STEM (Science, Technology, Engineering, Math)
The Questions and Takeaways
1. Do you struggle to communicate complex ideas?
Numbers are percentages. The cyan “C”represents Creatives and the magenta “S” represents Scientists.

Takeaway: Creative 8% never struggles; STEM 4% never struggles. This means both disciplines struggle occasionally, but few always struggle (Creative, 4%; STEM 3%).
2. What strategy do you MOST often use to achieve clarity when you communicate complex ideas?
Numbers are percentages. Creatives are cyan and Scientists are magenta.

Takeaway: At 52% "Create analogies" is very strong in STEM. "Create analogies" is also the strongest category for Creatives, at 36%. “Distilling the message” and “Visuals” are important to both Creatives value “a logical strategy” and "Input from others" more than STEM participants. We allowed for an “Other” option for participants who might not find their preferred method, and observed similarities in both fields. Additional strategies shared in “Other” that are MOST often used to achieve clarity noted by participants include: “Narrative - find the story” (both STEM and Creative); “Multiple options” (both STEM and Creative); “Never logic” (Creative); “Start at the end” (Creative); “Write and re-write” (STEM).
3. How important is communicating outside of your field to you?
Numbers are percentages. Creatives are cyan and Scientists are magenta.

Takeaway: Almost all respondents believed that communicating outside of their field was at the least “Moderately important.” We should note that we didn’t specify at what POINT in the course of completing their work it was important to communicate outside of their field.
3b. Please rate the importance of Effective Communication with people outside your field with regard to the following elements of your work.
Numbers are percentages. Ranked from “Extremely important” to “Not at all important” Creatives are cyan and Scientists are magenta.

Takeaway:
The reasons why Effective Communications with people outside of one’s field is important for STEM and Creative are very similar except “Societal impact”, “Public policy”, and “Project success”. STEM professionals are more interested in ”Societal impact” and “Public policy,” where Creatives cared more about “Project success” than STEM. Creatives view Effective Communications outside of one’s field as important in “Collaborations”.
“Idea development”, “Societal impact”, and “Collaborations” were some of the highest rated categories overall. “Peer recognition”, “Money/financial reasons” and “Career advancement” were some of the lowest rated, although still on average rated “Moderately important” to “Very important”. It was a surprise to us “Peer recognition” and “Financial gain” didn’t rank higher given the awards culture in creative industry. Unsurprisingly, for creatives, at 13% “Public policy” was ranked “least important” most frequently.
Grouping the reasons reveals a few patterns:
Outward facing: “Societal impact”, “Public policy”: High for Both, but comparatively higher for STEM
Project-based: “Idea development”, “Project success”, “Collaboration”: Higher for Creative, with the exception of “Collaborations”, which was quite high for STEM as well
Personal (practical) goals: “Career advancement”, “Money/financial reasons”, “Peer recognition” were rated lower for both
“Project success” for Creatives could mean when you meet client goals, when your work resonates with you audience, or when its being displayed (the later two involve some amount of communication), but the data indicates that for STEM, “Project success” isn’t hugely impacted by Communication. Perhaps because it may help them get to their next potential project (e.g. grant writing, proposal building), but won’t help with the success of the current project.
4. What format do you MOST use to communicate your work?
Numbers are percentages. Creatives are cyan and Scientists are magenta.

Takeaway:
It’s clear that “Writing”, “Speaking”, and “Pictures/images” are are utilized frequently for communication in both fields.
“Graphs/tables” are higher for STEM than for creative, but we surprised that “Graphs/tables” were not ranked higher. Interestingly, “Hands-on activities” rate higher for STEM than creative, whereas unsurprisingly “Painting/drawing/sculpture” are higher for Creative and lower for STEM. “Movement” and “Video” ranked in the middle for Creative fields, but ranked fairly low in STEM, which was somewhat surprising. “Experiential” activities enjoyed mid-low rankings, which shows that this could be a communication tactic worth exploring via collaboration. “Comedy” ranked low for both, but the researchers have seen growing interest in the STEM community to utilize “Comedy” in communication.
The “Other” category revealed a few interesting outliers. For Creative: “Illustration”, “Body language”, “Public art”, “Music and sound”, “Conversation”, “Embroidery”, “Websites”; for STEM: “Games”.
5. How do you find inspiration for you work?
We asked participants to rank the top 3 fields that inspired them. ”Creative view”: The top heat map with cyan text represents the Creative rankings in order of preference, compared with STEM. ”STEM view”: The bottom heat map with magenta text represents the STEM rankings in order of preference, compared with Creative. Green is most selected, yellow and orange are in the middle, and red is least selected.

Takeaway:
Top 5 in each field:
Creative: #1 “Life/culture/observation”, #2 “Asking questions/listening”, #3 “Talking to peers”, #4 “Research (trade publications)”, #5 “Exercise/walk/hike.”
STEM: #1 “Asking questions/listening”, #2 “Talking to peers”, #3 “Life/culture/observation”, #4 “Research (trade publications)”, #5 “Events/Talks”
Notable data points from the top 5:
• The top three in both fields is the same, but in different order
• Both Creative and STEM view “Research” as important
• “Events/Talks” rank high for STEM
Other notable data points:
• “Events/Talks” registered fairly low for Creatives
• “Travel” was #6 for creative, and #14 for STEM
• “RSS feed/social media” - middle for STEM, low for Creatives.
• “Music” very low for STEM, mid-low for Creatives.
• Consistently low for both - “Festivals”, “Games”, “Driving”, “Other’s work” (bottom 5 for both)
6. Do you ever have trouble coming up with ideas that are relevant to your work?
Numbers are percentages.

Takeaway: Not very big differences here. By and large, they both potentially do some of the time; 78% (Creative) - 72% (STEM). 22% Creatives and 29% STEM said “No” to having trouble coming up with ideas that are relevant to their work. It should be noted that we didn’t specify coming up with good or realistic ideas.
7. Are you inspired by other fields of work/study?
Numbers are percentages.

Takeaway: 99% of respondents were inspired by other fields of work/study.
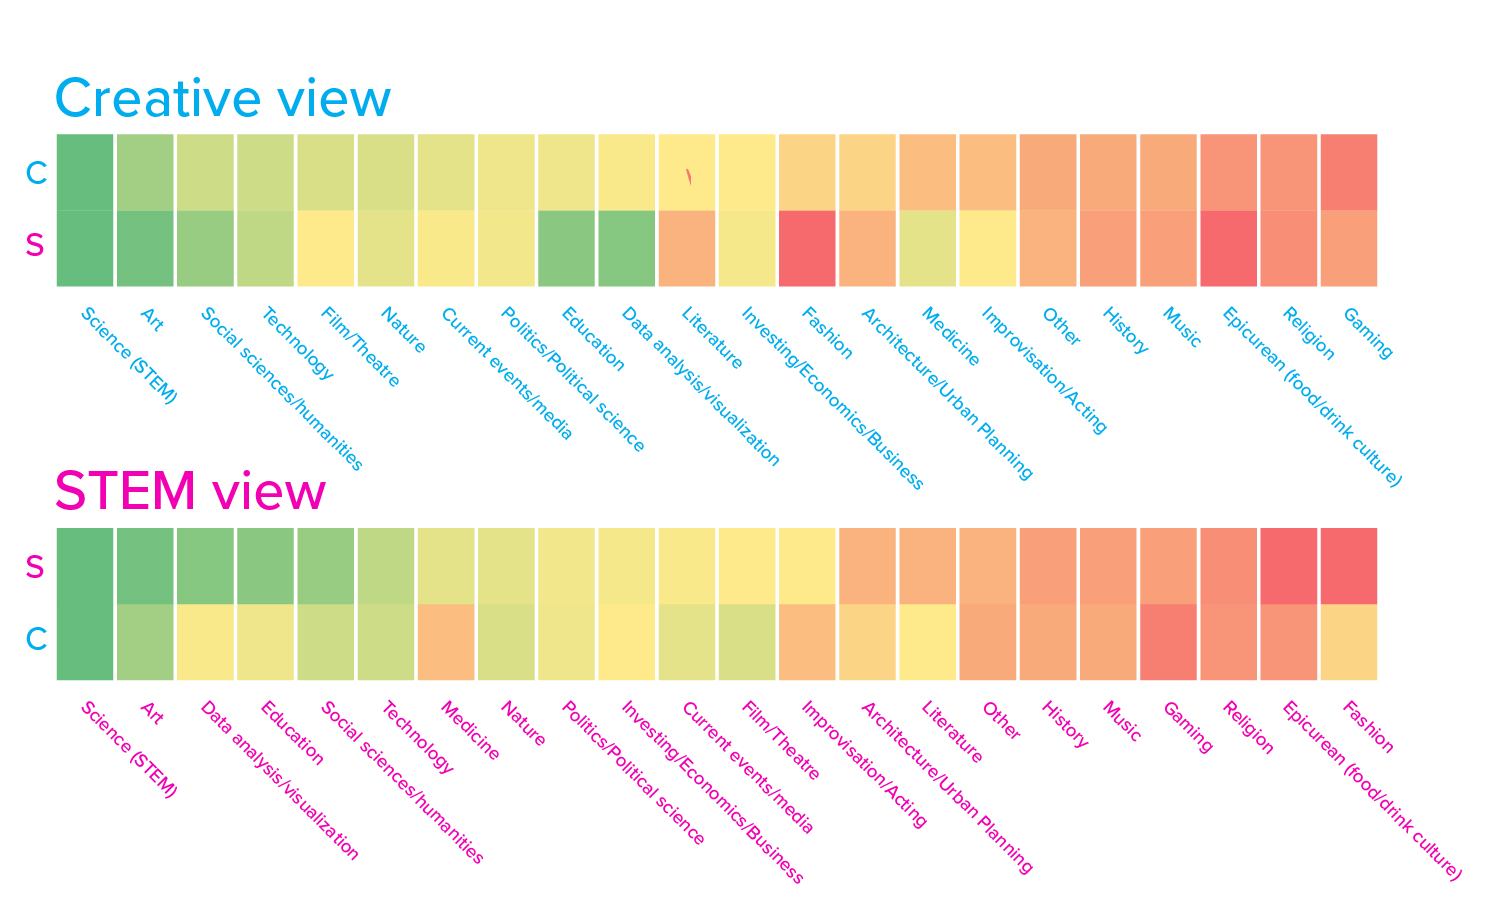
7b. If you answered yes to the previous question, which ones?
We asked participants to rank the top 3 fields that inspired them. ”Creative view”: The top heat map with cyan text represents the Creative rankings in order of preference, compared with STEM. ”STEM view”: The bottom heat map with magenta text represents the STEM rankings in order of preference, compared with Creative. Green is most selected, yellow and orange are in the middle, and red is least selected.

Takeaway:
Top 5 in each field:
Creative: #1 “Science (STEM)”, #2 “Nature”, #3 “Art”, #4 “Current events”, #5 “Film/Theatre”
STEM: #1 “Science (STEM)”, #2 “Nature”, #3 “Art”, #4 “Data analysis/visualizations”, #5 “Technology”
Notable data points from the top 5:
• Top 3 are exactly the same; “Science (STEM)”, “Nature”, and “Art”, in that order
• “Data analysis/visualization” - high for STEM, but middle in Creative
• “Film/Theater” - very low for STEM, but high for Creative
Other notable data points:
• “Education” - very low in Creative fields and high (#6) in STEM
• “Social sciences” - register as middle to high in both
• “History” - higher for Creative, lower in STEM
• “Current events”, “Literature”, “Politics/Political science” - middle to high in both
• “Investing/Economics/Business” mid-low in STEM, very low in Creative
• “Medicine” mid-high in STEM, but mid-low in Creative
• “Music” and “Fashion” low in STEM, middle in Creative
• “Epicurean (food/drink culture)”, “Religion”, and “Gaming” low among both
• Noted in “Other”: Creative: “Meditation/church”, “Books and podcasts”; Creative and STEM: “Working with students”
8. Do you find it useful to collaborate with other fields of study?
Numbers are percentages.

Takeaway:
The drop off between those who are inspired by other fields of study (previous question; Creative, 99.11%, STEM, 99.35) and those who find it useful to collaborate with other fields (Creative, 75.3%, STEM, 76.5) is interesting. What is the cause of this drop off? Where might there be miscommunications or different interpretations that impede collaboration? Could it be because not enough formal opportunities exist? Where might there be overlaps that could help facilitate collaborations? How do we best communicate between fields? How do we understand each others’ language as well as process?
8b. If you answered yes to the previous question, which ones?
We asked participants to rank the top 3 fields that inspired them. ”Creative view”: The top heat map with cyan text represents the Creative rankings in order of preference, compared with STEM. ”STEM view”: The bottom heat map with magenta text represents the STEM rankings in order of preference, compared with Creative. Green is most selected, yellow and orange are in the middle, and red is least selected.
Takeaway:
Top 5 in each field:
Creative: #1 “Science (STEM)”, #2 “Art”, #3 “Social sciences/humanities” and “Technology” tied, #5 “Film/Theatre” and “Nature” tied
STEM: #1 “Science (STEM)”, #2 “Art”, #3 “Data Analysis/Visualization”, #4 “Education”, #5 “Social science/humanities”
Notable data points from the top 5:
• Top 2 are exactly the same; “Science (STEM)”, then “Art”
• “Social science/humanities” and “Technology” rate high in both fields
* “Education” rates high in STEM, but is closer to the middle for Creative
Other notable data points:
* Low across the board - “Gaming”, “Epicurean (food/drink culture)”, “Religion”, “History”, “Improvisation/acting”
* “Fashion” ranked as a “0” for STEM, but is closer to the middle for Creatives
* “Medicine” is ranked fairly high in STEM, but mid-low in Creative
Notes:
* “Data Analysis/Visualization” is a very common and well established method of art and science collaboration
* It should be noted, many Creatives don’t typically collect data as part of their discipline
9. What are the first questions you start with once you have an idea?
We asked participants to rank the top 3 fields that inspired them. ”Creative view”: The top heat map with cyan text represents the Creative rankings in order of preference, compared with STEM. ”STEM view”: The bottom heat map with magenta text represents the STEM rankings in order of preference, compared with Creative. Green is most selected, yellow and orange are in the middle, and red is least selected.

Takeaway:
Top 5 in each field:
Creative- #1 “Does it matter? Is it relevant to the audience?” #2 “Will people be engaged with it?”, #3 “Will it be at effective addressing the given concern?” #4 “How Novel or Unique is the idea?” #5 “Is the idea Producible/Feasible?”
STEM- #1 “Does it matter? Is it relevant to the audience?” #2 “Will it be effective at addressing the given concern?” #3 “Is the idea Producible/Feasible?” #4 “How Novel or Unique is the idea?” #5 “Do I have (or can I get) Resources and Funding to realize the idea?”
Notable data points from the top 5:
• Both Creative and STEM cite “Does it matter? Is it relevant to the audience?” as the first question they start with once they have an idea
• “Do I have (or can I get) Resources and Funding to realize the idea?” ranks high for STEM
• “Will it be at effective addressing the given concern?” and “How Novel or Unique is the idea?” rank high
Other notable data points:
* “Do I have (or can I get) Resources and Funding to realize the idea?” is the 2nd lowest for Creatives
* Scoring lowest in both fields: “Is the idea scalable?”
* “Will people be engaged with it?” is #2 for Creatives but quite low for STEM
• Also scoring low for both Creative and STEM: “Do I want to make the personal (or team) investment?”
10. How often do you think about your audience when working on an idea or project?
Numbers are percentages. Creatives are cyan and Scientists are magenta.

Takeaway:
Both Creatives (60%) and STEM (41%) think about their audience when working on an idea or project “A great deal”; however Creatives have a much higher percentage in “A great deal”. “A lot” ranked higher than STEM (33%) than Creative (20%). No Creatives chose “Not at all” as an option while very few STEM (3%) professionals did.
This begs the question; when do Creatives and STEM professionals most think about their audience?
Perhaps STEM is more at the beginning and less over the course of the project?
11. How do you think about (i.e., get to know) your audience?
We asked participants to rank the top 3 fields that inspired them. ”Creative view”: The top heat map with cyan text represents the Creative rankings in order of preference, compared with STEM. ”STEM view”: The bottom heat map with magenta text represents the STEM rankings in order of preference, compared with Creative. Green is most selected, yellow and orange are in the middle, and red is least selected.

Takeaway:
Top 5 in each field:
Creative: #1 “Empathy with the person/situation (imagine yourself as audience)”, #2 “Ask why should they care”, #3 “Talk to audience/ask questions (in person, online)”, #4 “Interviews, observation”, #5 “User research/background info”
STEM: #1 “Ask why should they care”, #2 “Talk to audience/ask questions (in person, online)”, #3 “User research/background info”, #4 “Empathy with the person/situation (imagine yourself as audience)”, #5 “Attending Conferences”
Notable data points from the top 5:
• “Empathy with the person/situation (imagine yourself as audience)” is #1 for Creatives, but ranks at #4 with STEM
• “Ask why should they care” ranks high for both
• “Talk to audience/ask questions (in person, online)” ranks high for both
Other notable data points:
• “Attending Conferences” ranks in the top 5 for STEM, but is in the middle for creatives
• Lowest for Creatives: “Research papers” (doesn’t exist), “Google analytics/stats”, “Create personas”
• Lowest for STEM: “Create personas”, “Google analytics/stats, social media” (middle for creative)
• “Interviews, observation” ranks high with Creatives, but in the middle with STEM
12. Which best describes how you first approach implementing an idea?
Numbers are percentages. Creatives are cyan and Scientists are magenta.

Takeaway:
Creative and STEM both selected “Think big, then distill (brainstorm)” as how they first approach implementing an idea. Creatives then opted to “Just go for it, dive right in”, which STEM professionals also selected, but as a tie with “Research existing data,” which was quite low for Creatives. “Strategize (create a road map)” and “‘Model’ it (create a model/comp/sketch)” were ranked next; interesting in that they are both ways of externalizing an idea. This ranking has created a natural funnel for ideation: first, “blue sky” thinking, then externalizing (“‘Model’ it”, Strategize”, “Do the experiment”), and finally critique (“Input from others”, “Collect new data, then reevaluate”).
13. Have you ever felt stuck in implementing an idea?
Numbers are percentages. Creatives are cyan and Scientists are magenta.

Takeaway:
Most feel stuck implementing ideas sometimes (95% Creative; 98% STEM). 80% of Creatives and 83% STEM said “Yes” they feel stuck implementing an idea sometimes. 15% in each group said “Maybe”, which leaves us with only 5% Creatives and 2% STEM who don’t feel stuck implementing an idea.
14. When do you know your work/project is complete?
Numbers are percentages. Creatives are cyan and Scientists are magenta.

Takeaway:
Creatives know their work or project is complete by “It is a feeling” or “External factors (budget, timeline, deadline, etc)” which are interestingly in opposition, in that “It’s a feeling” implies a gut instinct, whereas “External factors” are imposed upon one by external forces. STEM professionals clearly expressed that “External factors” are the driver for when a project is complete, followed by “When it’s clearly communicated”, then big drop off to “Others” which are cited below. Never - is third lowest for both (for STEM tied with “When it evolves”. “When it evolves” is comparatively low for Creatives.
“Other” option for STEM include “When the story comes together (data come together to tell a full story)” and “publication”. Also mentioned, when it’s “usable to others”, and a “combo of all.” “Other” options for Creatives include “When it is installed,” “When I start fiddling,” and “When I'm paid.”
15. Do you ever revisit something (i.e., work/a project) once it is done?
Numbers are percentages. Creatives are cyan and Scientists are magenta.

Takeaway:
Both Creatives and STEM professionals usually revisit elements of their project once it’s considered “done”. There was a single exception; one STEM professional who said “No” they DIDN’T revisit something once it was done.
”Other” reasons for Creatives include for the purpose of “Nostalgia”, “Sometimes”, and “I’d like to but I don’t have the budget to”.
16. Please share any tips for an aspiring professional in your field to develop or communicate their ideas.
These word clouds represent the comments that were provided by respondents. Creatives are cyan and Scientists are magenta.


17. Any other comments?
Respondents were invited to share other comments. Comments included: tips on ideation, survey feedback, enthusiasm about the project as well as criticism, and so on. Comments are integrated in the formal report.